Page 14 - Accountant Jan-Mar 2019
P. 14
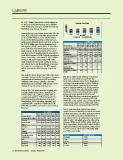
Signature Qualification CA that Empowers to Lead PAKISTAN Rs. 153.7 billion (Revised: Rs. 168.95 billion) in Pakistan Total Debt FY 2017, Rs. 138.8 (Revised: Rs. 147.6 billion) 30,000 in FY 2018, thus posing an overall decrease by 25,000 7,796 20,000 15,000 4,877 4,775 5,418 5,919 10,000 10,907 12,193 13,626 14,849 16,416 5,000 During the four-year tenure from June 2013 to 0 14-Jun 15-Jun 16-Jun 17-Jun 18-Jun June 2017, Pakistan’s total debt was increased (Rs. in billion) by Rs. 6,760.4 billion from Rs. 14,007 billion A. Domestic Debt B. External Debt (Rs. Billion to Rs. 20,768 billion posting a 48% increase. However, as detailed above, out of Rs. 6,760.4, (Million US$) Rs. 292.99 billion was due to devaluation of Jun-14 Jun-15 Jun-16 Jun-17 Jun-18 PKR against USD (From Rs. 99.11 in June 2013 US Dollar Parity 98.8088 101.7895 104.7619 104.8861 121.545 to Rs. 104.89 in June 2017) which accounts a External debt (Million US$) 48,442 46,861 51,714 56,430 64,141 total increase of 4%. Increment of Rs. 2,278 Paris Club 13,607 11,664 12,678 11,973 11,643 was due to PSDP spending which accounted a Multilateral 26,269 25,245 27,488 28,437 29,063 total debt increase of 34%. Federal spending in Other Bilateral 4,385 4,941 5,445 6,323 8,674 form of subsidies contributed Rs. 931.5 billion Euro/Sukuk global bonds 3,550 4,550 4,550 4,800 7,300 to the public debt representing 14% of the Military debt 36 0 0 total increase for four years. Lastly, Rs. 1,635.5 Commercial loans 323 300 1,457 4,877 7,461 was added due to additional share in revenue Local currency securities 16 32 35 (PIBs) to provinces consequent to 7th NFC awards, Saudi fund for 140 100 60 20 which accounted a total increase in debt by development (SFD) 24%. Local Currency Securities 116 29 1 (T Bills) The analysis above shows that 76% of the debt The above table shows breakup of External government was utilised in PSDP spending, debt from June 2014 to June 2018. The additional NFC shares, subsidies and PKR Paris Club, common name for 18 developed devaluation and a meagre 24% was left to be countries, formerly known as Aid to Pakistan utilised at the discretion of federation. Consortium shows a decreasing trend from 2014 to 2018 by 14.43%. The most preferred During 2017-18, which was the election year and was partly governed by ‘caretakers,’ Rs. Multilateral Loans and bilateral loans shows 3,444.1 billion was added to public debt in increase in same period by 10.63% and a single year, which is 51% in comparison to 97.8%. While the non-conventional mode of debt increment during previous four years. Devaluation, PSDP spending, subsidies and during the same period. The commercial loans additional NFC payments contributed 27%, representing support from China and others 16%, 4% and 15% to the total increase during shows steep rise in same period by 2209.9%. the year. As it is now clear that debt of any nation (Rs. in billion) cannot be seen in isolation to assess economic Jun-14 Jun-15 Jun-16 Jun-17 Jun-18 performance; there are other indicators which A. Domestic debt 10,907 12,193 13,626 14,849 16,416 are used while comparing indebtedness of B. External debt (Rs. billion) 4,877 4,775 5,418 5,919 7,796 any nation. One such commonly used factor is Total debt 15,784 16,968 19,044 20,768 24,212 debt to GDP ratio which was 62%, 58%, 64%, Increase in debt 1,776.1 1,184.2 2,075.7 1,724.3 3,444.1 65% and 70% for 2014, 2015, 2016, 2017 and Due to: 2018 respectively. Debt to GDP ratios of other USD parity - 147.12 139.44 6.42 939.80 regional countries of Bangladesh, India, China PSDP 441.02 502.20 602.06 733.34 555.22 and Sri Lanka for 2017 were 27%, 69%, 48% Subsidies 323.02 243.00 196.54 168.95 147.60 and 78% respectively. Cost of NFC 339.58 371.55 449.67 474.70 530.91 US $, last day average 98.81 101.79 104.76 104.89 121.54 Countries Debt to GDP % 2017 exchange rates Bangladesh 27.10% GDP 25,402 29,078 29,598 31,862 34,396 China 47.60% Tax revenues 2,375 2,729 3,265 3,532 3,751 Pakistan 65.18% Tax to GDP 9% 9% 11% 11% 11% India 68.70% Debt to GDP 62% 58% 64% 65% 70% Sri Lanka 77.60% 12 The Pakistan Accountant January - March 2019